Smart and easy observability
Get onboard ClaiObserver, your reliable companion for a relaxed could-native journey!
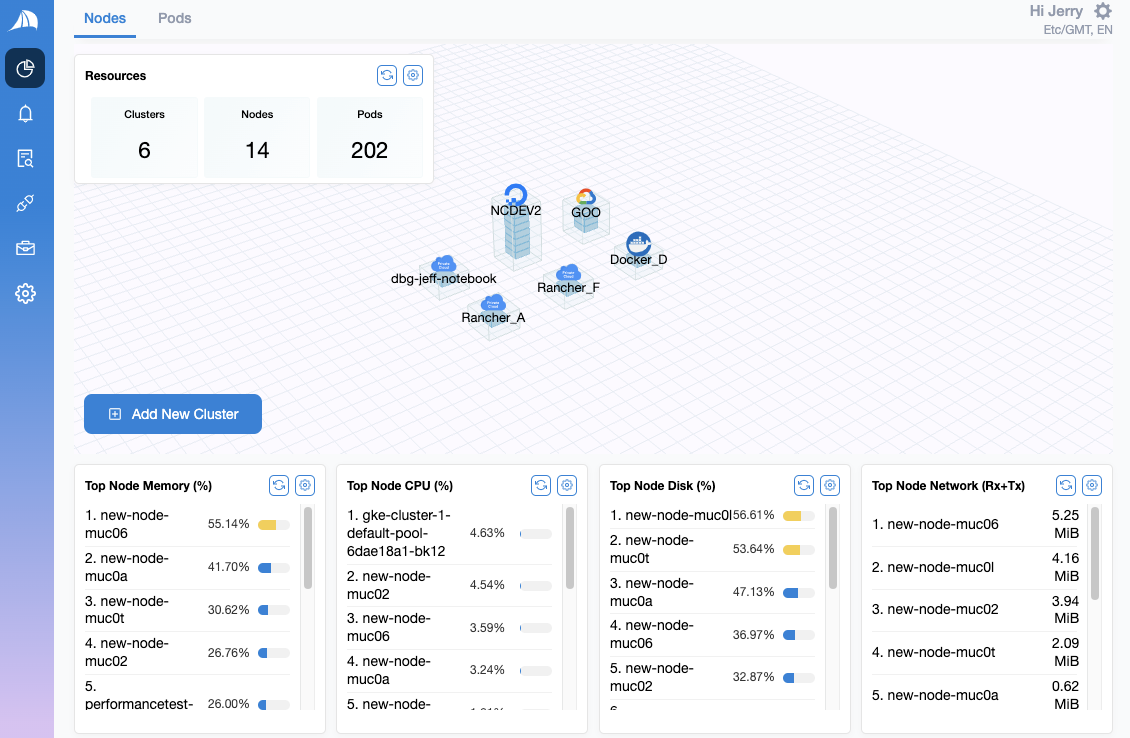
Our extended observability service is based on the Prometheus stack and offers the easiest way to implement observability for your Kubernetes, OpenStack, or hybrid environments. Our observability packages either include Prometheus or can easily be implemented on your existing Prometheus stack and maximize its benefits with added intelligence and automation to guarantee smooth DevOps workflows.
You can lean back and enjoy a smooth ride as we take the wheel.

Let ClaiObserver do the work for you
Observability with intelligence and automation
- Easy to use extended observability on the Prometheus stack
- Proactive and intelligent incident resolution
- Automated operation with scale support
Your extended Prometheus ecosystem
Based on open source technology
Benefit from the best that the open source community has to offer without the need to develop your own architectures. ClaiObserver is your dock to an extended Prometheus ecosystem with its proven solutions and our own open-source projects. Work with the technology you know and trust, while we do the heavy lifting for you!
- Benefit from our open source expertise
- Grafana dashboards, Loki & Promtail for logs, tracing with Tempo & OpenTelemetry
- ClaiObserver OSS, including ExporterHub service and Sudory server & client


No unwanted surprises
All-in pricing per node
We make sure you know exactly what to expect with our predictable all-in packages priced per node. No hidden cost, unexpected overage, or vendor lock-in as our service easily integrates with your existing investments. Saving you precious time and money is our top priority – our solution grows together with you.


